�������ʶ�þ�Ͻ�������Ĥ�ṹ����ʴ�Ե�Ӱ�죨Ӣ�ģ�
����ʱ��:2019��9��21�� �����:2520
1 Experiment
The chemical composition of AZ91D magnesium alloy used for substrate material in this study are as follows (wt%) :Al8.3~9.7, Zn 0.35~1.0, Mn 0.17~0.27, Si 0.1, Cu<0.03, Ni<0.002, Fe<0.005, Mg balance.The specimens were machined to the rectangular pieces, with the dimensions of 30 mm��20mm��10 mm.In order to remove the oxide skin formed during machining, the surface of the specimens was ground on 400grit silicon carbide paper.And then the specimens were rinsed in water and dried in warm air before MAO process.
According to the results of earlier experiments, the MAO coatings with the same thickness but different growth rates (as shown in Table 1) were prepared, using a home-made power supply by controlling the power voltage and treatment time.The silicate electrolyte prepared with high purity chemicals and deionised water was continuously stirred and cooled to ensure the temperature in the range of 20~40��C during the MAO treatment.The specimens connected with an aluminium wire of 3 mm in diameter were used as anode and a piece of stainless steel plate was employed as cathode.
Surface morphologies of PEO coatings were researched by a JSM-6700F scanning electron microscopy (SEM) and cross-section morphologies of coatings were detected by a JSM-5600LV scanning electron microscopy.The size and amount of micro-pores on coating surface were counted quantitatively by Image J software.Phases of coatings were investigated by X-ray diffraction (XRD) , employing a Ricoh D/MAX-2400 instrument with a scan range from 10��to 80�� (in 2��) , a step length of 0.02��and a Cu K��radiation source.An EPMA-1600 electron probe micro-analyzer was used to analyze the distribution of key elements on the cross-section of coatings.The mass of specimens before and after PEO treatment was measured by a BP211D analytical balance.A TT260 coating thickness gauge was used to measure the thickness of PEO coatings and the mean of 10 measured values was calculated and used as the thickness of PEO coatings to ensure accuracy of the results.
A CHI660C electrochemical workstation and a three-electrode cell were used to obtain potentiodynamic polarization curves of the bare metal and the MAO coated samples corresponding to different coating growth rates.The specimens were used as the working electrode, accompanied with a platinum counter electrode and a saturated calomel reference electrode (SCE) .After the specimens with an exposed surface area of 1 cm2were immersed in 3.5wt%Na Cl solution for 30 min at room temperature, the potentiodynamic polarization test proceeded at a scan speed of 5 m V��s-1and a scan range of�C1.8 to�C1.3 V.

2 Results and Discussion
2.1 Coating morphologies and micro-pores on the coating surface
Fig.1 shows surface morphologies and distributions of the micro-pores on the surface of the coatings with the same thickness but corresponding to different growth rates.Surface morphologies reveal obvious qualitative changes in the shape and size of the micro-pores when the growth rate of the coating is increased.For the coating with the growth rate of 1��m/min, micro-pores are small and some of them are close to each other and even connect together.Increasing the coating growth rate, the micro-pores grow constantly, accompanied with a rise in the amount of micro-cracks on coating surface.

Fig.1 Surface morphologies and distributions of micro-pores on coatings with different growth rates of 1��m/min (a, a��) , 5��m/min (b, b��) , 15��m/min (c, c��) , and 25��m/min (d, d��) ����ԭͼ
The surface porosity, the total amount of the micro-pores (Fig.2a) and the amount proportion of that in different size (Fig.2b) were counted quantitatively by Image J software on SEM images of the coating surface, within an area of 5��104��m2.Fig.2a shows similar trends for the surface porosity and the total amount of the micro-pores of the coatings with different growth rates.With increasing growth rate from 1��m/min to 15��m/min, they both decline continually and slightly increase at the growth rate of 25��m/min.
Fig.2b reveals a varied amount percent of the micro-pores in different sizes.For the coating with the growth rate of 1��m/min, the amount percent of the micro-pores whose equivalent diameter (Feret diameter) is less than 2��m is the largest but that in the range 2~5��m and larger than 5��m are both the smallest, compared with the coatings fabricated with other growth rates.When the coating grows in the rate of 5��m/min, the amount percent of the micro-pores whose equivalent diameter is in the range 2~5��m and larger than 5��m both increases obviously and continues to increase slightly at the growth rate of 15��m/min.However, a drop of that in the range 2~5��m and a continuous rise of that larger than 5��m are observed at the growth rate of 25��m/min.So it is seen that the amount percent of the larger micro-pores (larger than 5��m) on coating surface remains increasing continually with coating growth rate.
The transformation reason of the amount of the micro-pores in different size on coating surface was analyzed.When the coating grew at different rates the different power voltages were loaded during micro-arc oxidation treatment.For the coating with the growth rate of 1��m/min, the least energy is accumulated when the breakdown evenly occurs on specimen surface due to the smallest power voltage provided.As a result, the micro-pores in the smallest size and largest amount form on the coating surface.Increasing coating growth rate means a larger power voltage.Hence more energy is produced and accumulated to result in following breakdown events occurring easily and repeatedly in some weak areas of specimen surface during the breakdown process, which would lead to a rise in the size but decay in the number of the micro-pores.So the total amount of the micro-pores decreases and the amount percent of the larger micro-pores increases constantly when the growth rate is continually improved to 15��m/min.For the coating with the growth rate of 25��m/min, the highest power voltage used leads to the most energy generated during the breakdown.Although non-uniformed distribution of the energy generated on specimen surface becomes more serious, the total energy increases obviously.As a result, the mount percent of the larger micro-pores continues to increase but the total number of the micro-pores slightly increases instead of declining.

Fig.2 Statistical results of micro-pores on surface of coatings (within area of 5��104��m2) prepared with different growth rates: (a) surface porosity, total amount of micro-pores and (b) amount percent of micro-pore in different sizes ����ԭͼ
2.2 Cross-section morphologies of the coatings
Fig.3 shows the cross-section morphologies of the coatings with the same thickness but different growth rates.Less micro-pores appearing on the cross-section of the coating with the growth rate of 1��m/min disclose a high level of the compactness of the coating.And when the growth rate is increased more micro-pores appear on the cross-section of the coatings.

Fig.3 Cross-section morphologies of coatings prepared with growth rate of 1��m/min (a) , 5��m/min (b) , 15��m/min (c) , and 25��m/min (d) ����ԭͼ
2.3 Phase composition and element distribution of the coatings
Fig.4 shows XRD patterns of the coatings with different growth rates.By comparison of XRD patterns of the coatings with different growth rates, it reveals the same phase composition which mainly contains Mg O, Mg F2, Mg2Si O4and Mg Al2O4phases.The presence of Mg and Mg17Al12phases is attributed to X-ray penetrating the relatively thin coating into the substrate.The results of the XRD analysis show that the coating growth rate has no effect on the phase composition of the coatings.
The content distribution of the key elements Mg, Al, Si, O and F on the cross section of the coatings are presented in Fig.5.According to EPMA analysis, the content distribution of each element on the cross-section of the coatings remains constant when the growth rate is changed.Compared with other regions of the coatings, the substrate/coating interfaces are rich in the element Mg.The element Al is distributed evenly on the cross-sections of the coatings.The outer layers are rich in the elements Si and O but the inner layers are rich in the element F.The results of the EPMA examination indicate that the coating growth rate also has no influence on the content distribution of each key element on the crosssection of the coatings.
According to element composition of the substrate and electrolyte, we know that the coating elements Mg and Al come from the substrate while the elements Si, O and F from the electrolyte.The elements, including the above five elements from the substrate and electrolyte, appearing in the coating suggest that the reaction ions come from the substrate and electrolyte, and migrate in opposite direction in the effect of electric field during MAO process.When the reaction ions meet on specimen surface the formation reactions of MAO coating occur.An increase of the coating growth rate indicates that the migration of the reaction ions and the formation reaction of the coating are both accelerated.However, based on the results of the elemental distribution in Fig.5, the content distribution of the key elements on the cross-section of the coatings does not vary with the increasing of growth rate.So it is concluded that the coating growth rate has an impact on the migration speed but no effect on the distribution of the reaction ions.

Fig.4 XRD patterns of MAO coatings with different growth rates ����ԭͼ

Fig.5 Distributions of key elements on cross-section of coatings prepared with growth rate of 1��m/min (a) and 15��m/min (b) ����ԭͼ
2.4 Coating compactness
According to the morphologies of the coatings (Fig.1, Fig.3) , the obvious changes of the size and amount of the micro-pores on coating surfaces with the coating growth rate indicate a change in the compactness of the coatings.In the present study, because the phase composition of the coatings with different growth rates remained constant (Fig.5) , the evolution of coating compactness could be researched roughly via the variation of the mass to thickness ratio of the coatings.Thus, a larger mass to thickness ratio of the coating usually demonstrates a greater coating compactness.
Fig.6 shows the mass and mass to thickness ratio of the coatings with different growth rates.A similar trend which decreases constantly with the increasing of growth rate is visible.Compared with other coatings, the coating with the growth rate of 1��m/min has the biggest mass to thickness ratio of 2.82 mg/��m and hence the coating compactness is the largest.The continual reduction of the mass to thickness ratio of the coatings reveals that the coating compactness decreases constantly.So for the coating with the growth rate of 25��m/min, the smallest mass to thickness ratio of 2.37 mg/��m demonstrates the least density.
2.5 Corrosion resistance of the coatings

Fig.6 Mass and mass to thickness ratio of coatings prepared with different growth rates ����ԭͼ
Fig.7 shows the potentiodynamic polarization curves of the bare metal and the MAO treated specimens corresponding to different coating growth rate.The values of the corrosion current densities (Icorr) and the linear polarization resistances (Rp) gained by fitting the above polarization curves were shown in Table 2.Compared with the bare metal, obvious drops in corrosion current density and rises in linear polarization resistance (by more than 1~3 orders of magnitude) for the MAO treated specimens suggest all the MAO coatings provide significant corrosion protection for the substrates.According to comparison of the values of Icorrand Rpobtained from the MAO treated specimens, the coating with the growth rate of 5��m/min has the biggest corrosion resistance, in turn followed by the coatings with the growth rate of 15, 1 and 25��m/min.So the coating with the growth rate of 5��m/min provides the best corrosion protection for the substrate.By contrast, the same order of magnitude of Icorrand Rpindicates a slightly weaker corrosion resistance for the coating with the growth rate of 15��m/min.However, the corrosion resistance of the coatings with the growth rates of 1��m/min and 25��m/min decreases obviously because of the obvious rises in corrosion current density and drops in linear polarization resistance.Compared with other coatings, the coating with the growth rate of 25��m/min has the worst corrosion resistance.To the authors��view, the corrosion resistance of MAO coating on magnesium alloys is mainly affected by the thickness, phase composition, microstructure and surface defect of the coating.XRD patterns of the coatings have suggested that the phase composition of the coatings with different growth rates is the same (Fig.4) , so the corrosion resistance of the coatings with the same thickness is mainly under the influence of the microstructure and surface defect of the coating.The microstructure of the coating mainly consists of the compactness and surface porosity of the coating.The surface defect mainly refers to the larger micro-pores and micro-cracks on coating surface.For the coating with the growth rate of 25��m/min, the least coating compactness, the biggest amount percent of the larger micro-pores and the most micro-cracks on coating surface make it easiest for the corrosion substance to pass through the coating into the substrate, so the coating has the worst corrosion resistance.Compared with the coatings with the growth rate of 5��m/min and 15��m/min, the coating with that of 1��m/min has an obvious bigger surface porosity, which indicates an easier migration for the corrosive substance;therefore the corrosion resistance of the coating is weaker.Although the coating with the growth rate of 15��m/min has a relatively smaller surface porosity, its surface is covered by more micro-cracks and larger micro-pores, so its corrosion resistance is slightly less than that with the growth rate of 5��m/min.

Fig.7 Potentiodynamic polarization curves measured on bare metal and coated samples corresponding to different growth rates of the coating ����ԭͼ
Comparing the coatings with different growth rates and anti-corrosion properties, the coatings with the growth rates of1��m/min and 25��m/min have the lowest growth rate and the least corrosion resistance respectively.Although the coating with the growth rate of 15��m/min has a slightly weaker corrosion resistance than that of 5��m/min, its growth rate is larger significantly.So in consideration of productive efficiency and anti-corrosion performance, the coating with the growth rate of 15��m/min, which has a higher growth rate and relatively excellent corrosion resistance, shows advantage in industrial application compared with other coatings.

3 Conclusions
1) The key factor of this research is a unique experimental design to fabricate coatings with the same thickness but by different voltages corresponding to different coating growth rates of 1��m/min, 5��m/min, 15��m/min and 25��m/min.
2) The characteristics of the coatings, such as the surface porosity, the size and amount of micro-pores on coating surface, mass and mass to thickness ratio are affected considerably by the coating growth rate.However, the phase composition and element distribution of the coatings remain almost unchanged with the increasing of growth rate.
3) Improving the coating growth rate, the micro-pore��s size on coating surface increases obviously and the amount of the micro-pores and the surface porosity decreases continually, but slightly increases at the growth rate of 25��m/min.The amount of the larger micro-pores (>5��m) , micro-cracks on coating surface and the micro-pores on the cross-section of the coating all increases gradually.
4) The coating with the growth rate of 5��m/min exhibits the best corrosion resistance, and then followed by the coatings with that of 15��m/min, 1��m/min and 25��m/min.In consideration of productive efficiency and anti-corrosion performance, the coating with the growth rate of 15��m/min, which has a higher growth rate and relatively excellent corrosion resistance, shows advantage in industrial application compared with other coatings.
-
-
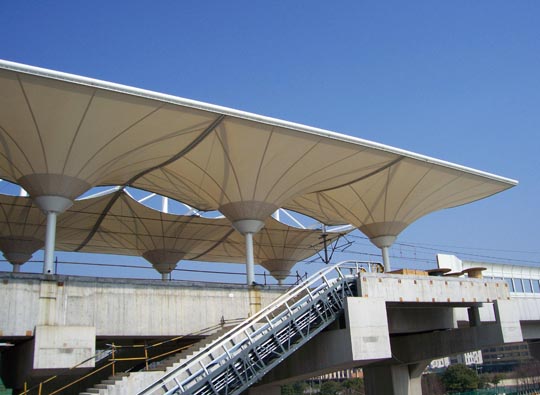
 Ĥ�ṹ���������ڳļ��ղ���Ϊ�ຣʡ��������������Ͻ�أ��ຣʡ���²���ԭ�����س��������ģ���Ϊ�ղ��صı�־�Խ�������������Ϊֱ��50��Բ�ν�...
 -

-
 Ĥ�ṹ�����Ӧ���ݸ��Ƿ������ϲ���Χ���ṹ��Ӧ������Ӧ��ʹ�ù��ܵ�Ҫ��Ϊ�����ṩ���˵��ڲ��ռ价�����ݸ�Ҳ�Ƿ��ݶ����ij��ؽṹ���ܵ���...
 -
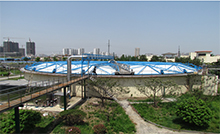 Ĥ�ṹӦ���ڻ������������ҹ����÷��ٷ�չ������������ʩ����ȫ��չ�����ر�����ˮ�������Ȼ�����Ŀ�������࣬�������൱��������ˮ������������...
 -
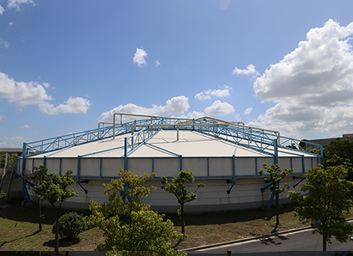 Ĥ�ṹ����ˮ���������൱��������ˮ�������������ء�����Ũ���ء����������صȽ��ھ��������������ܱߣ���ˮ�صĻ�������ò����ˮ��ζ��ֱ��Ӱ������...
- ��������
-
�������ƿ���|sd-wan|�ϲ����|��Ĥ����| ��ˮ������|����ֹ��ȼ�|ˮ��������|������|��ЯʽС����|���ﰲ�����|ľ�ܵذ�|���ϴ���|����װ�� |Ⱦ��|ʳƷ��е��|����Ԫ����|�γ����˹�˾|Ѳ�� |��̨�豸|�ۺ��Ȼ���|����ϵͳ|���̨| ��ѹ��|��ͷ���ȹ�|3d��ӡ��|�Ϻ�����| ������չѵ��|���°�|��е��Ϣ��|�����| ����������|�ǻ��õ�|�ڹ�¯����|���س���| ���ߴ���������|��������|LED����|PVCʩ��Χ��| ��ҵ��ˮ|�����豸|��ϻ���|��ڹ�
�й���ϲ������վ
+021-59198545
400-176-6885
dshx@hxmjg99.com
www.hxmjg.com
��ICP��12007123��-1
ʹ������
